Yara's interdisciplinary team from technical, process data and operations at Herøya has created a single image that shows the operating status in the production plant and a calculation tool that makes it easier to manage the fertiliser quality from Porsgrunn more precisely. The tools improve fertiliser quality, make better use of raw materials and reduce emissions.
Thousands of data boiled down into one image
Thousands of process data tags from fertiliser production have been boiled down to nine simple columns presented in one image.
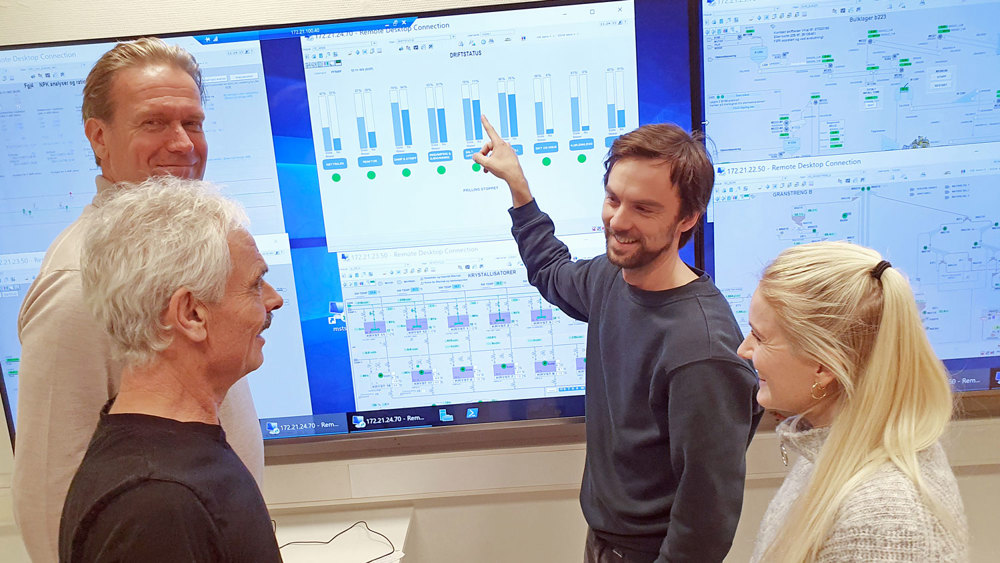
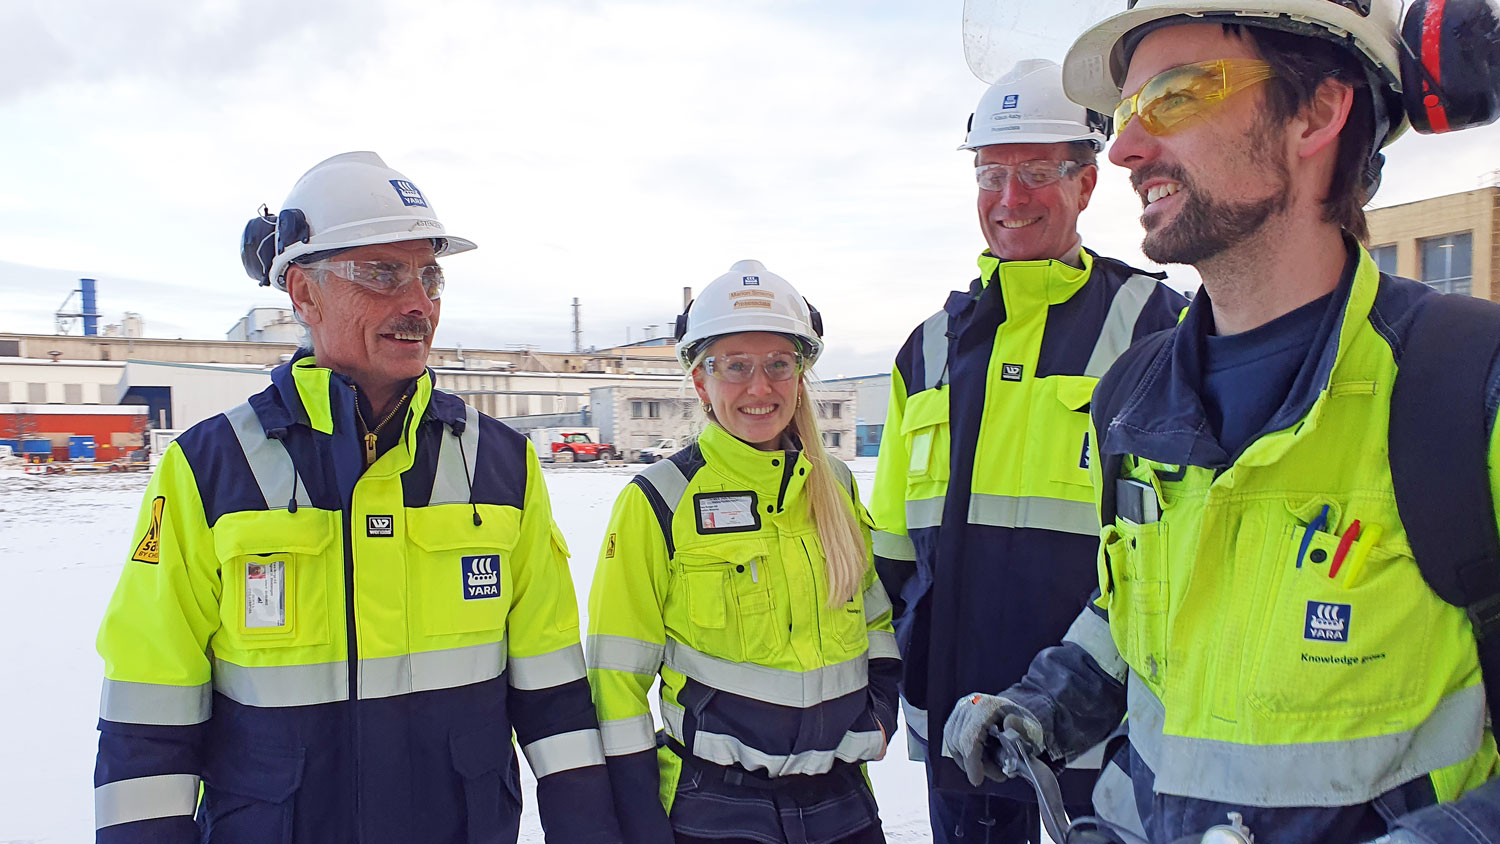
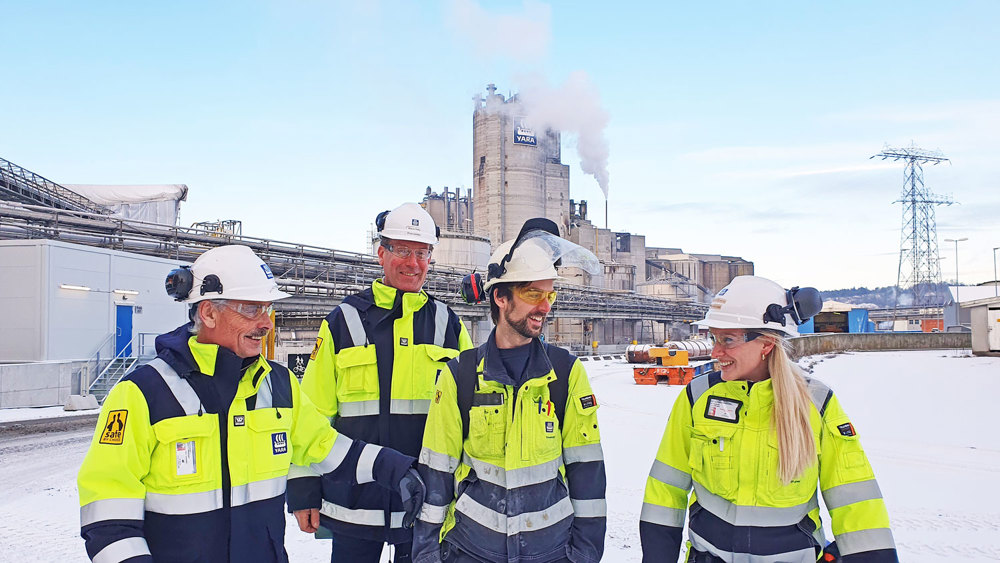
"You don't need any knowledge of the process to read and understand this," say Kim Erland Lie and Marion Smemo, on the right in the photo above. Together with colleagues, they have been at the forefront of developing columns and color codes, all presented on one page.
"Putting it simply, the image shows how the production units are run. The image is divided into 9 plant parts with columns indicating the average degree of utilisation over the last 8 hours and instantaneous values. These columns represent facilities with a great number of tags, about 4,000," the process team says.
Help to manage production
The image will help operators plan and make decisions in fertiliser production.
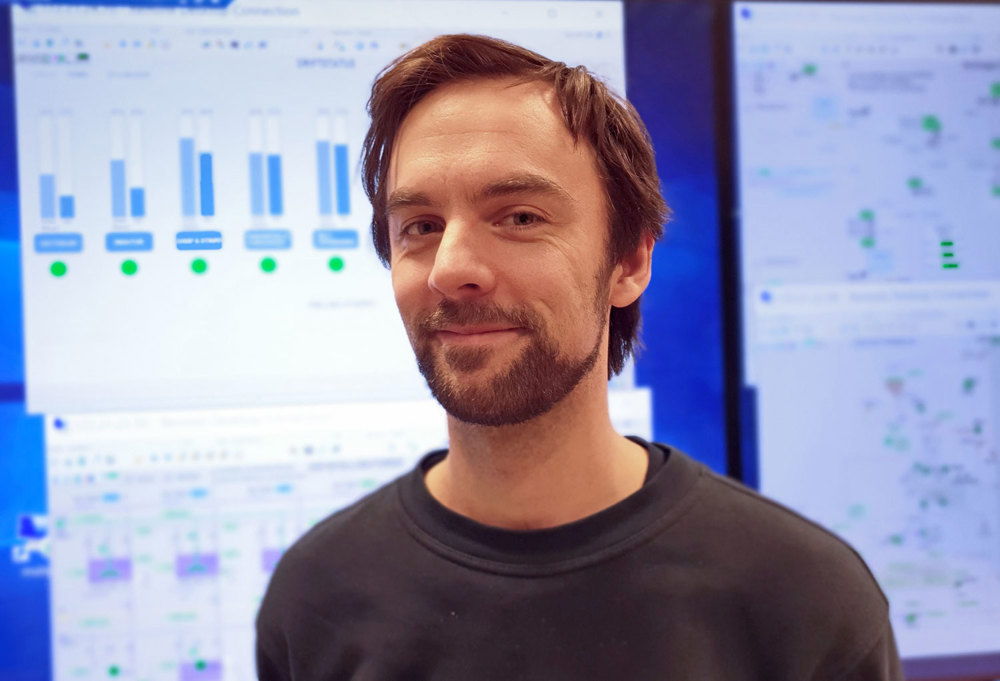
"Operators can operate according to this picture," says Kim Erland, process operator who now works full-time with process improvements.
"Here we see where the shoe is pressing and can identify bottlenecks in terms of quality. If you click on one of the blocks, red or green, you will see actual data and values. There is no judgment involved here," he points out.
Effective presentation of status
"How is this new presenting tool compared to previous process overviews?"
"This is a completely new way of presenting status," says Kim Erland. "Operators may be a little skeptical at first, but over time I think we will see the benefit of getting an instant picture of the process, without having to dive into all the data. Here we get the status of quality, raw material mix, emissions and more. In principle, a person can sit at home, see the status and follow the process," he says.
"A flow chart is the classic way of showing an overview of the process where all information is entered, perhaps 200 data. With this new system you don't have to browse and search."
Modules easy to implement
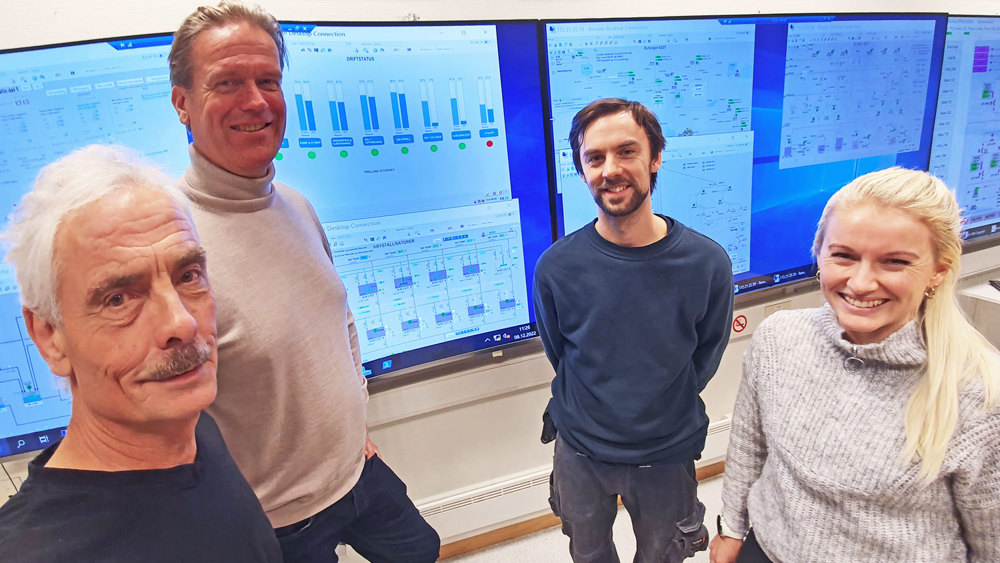
"The modules are laid out for each plant part, and can be realized in any control system," says Marion Smemo.
"Now we have the basis and can realize the equivalent for fertiliser plant 3. In fertiliser plant 4, this tool was put into operation before the summer of 2022."
Control of quality and production
Ingvar Westengen, from the technical section, says they are beginning to recognise contours from production in the new overview image.
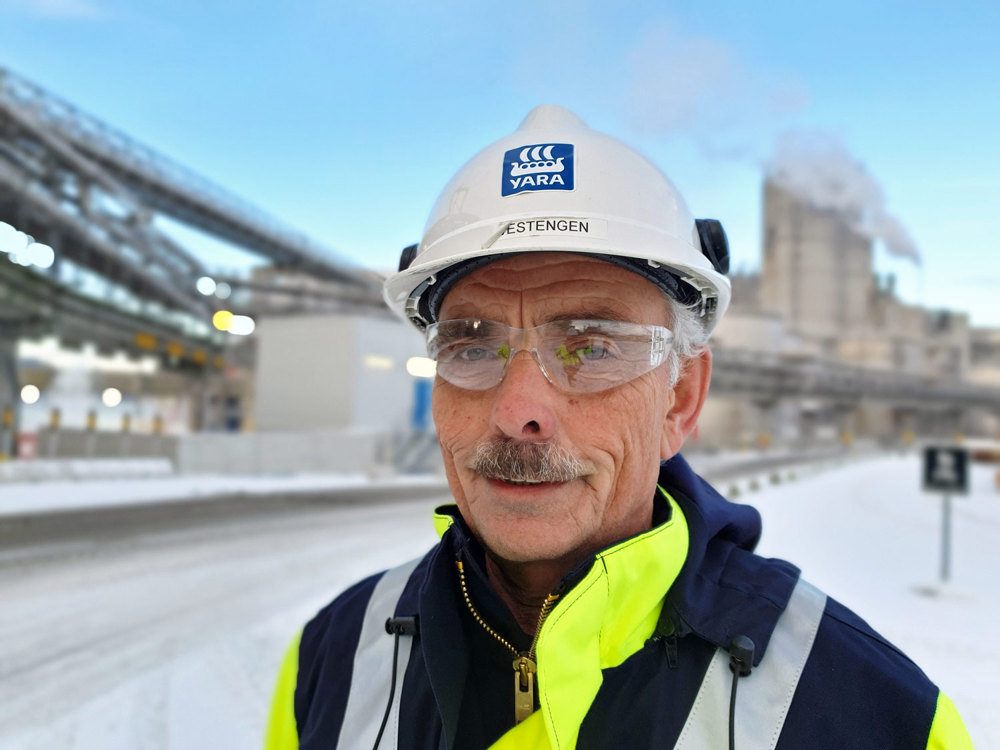
"We are starting to get a profile through the plant parts for the different product types, which helps the operators to adjust production to avoid variations in the final product," says Westengen.
"We produce 2.3 million tonnes of NPK fertiliser a year. We have around 50 different fertiliser qualities, specific recipes and short intervals in the production of different qualities, so there is a lot to take into account."
Remove manually submitted information
"It became clear early on, we had to remove manual transmissions of information to operators, because they are the ones who can influence production," Westengen continues.
"Finding out how operators should make use of information from the lab analyses, which reduces variations in the final product, has been essential. Now they can make smart adjustments using the new quality tool."
Fully integrated control system
Yara Porsgrunn now manages fertiliser production in a fully integrated management system.
Klaus Aaby, from Process Data, talks about an extensive job done together with Bazefield and Tietoevry, compiling data from different systems.
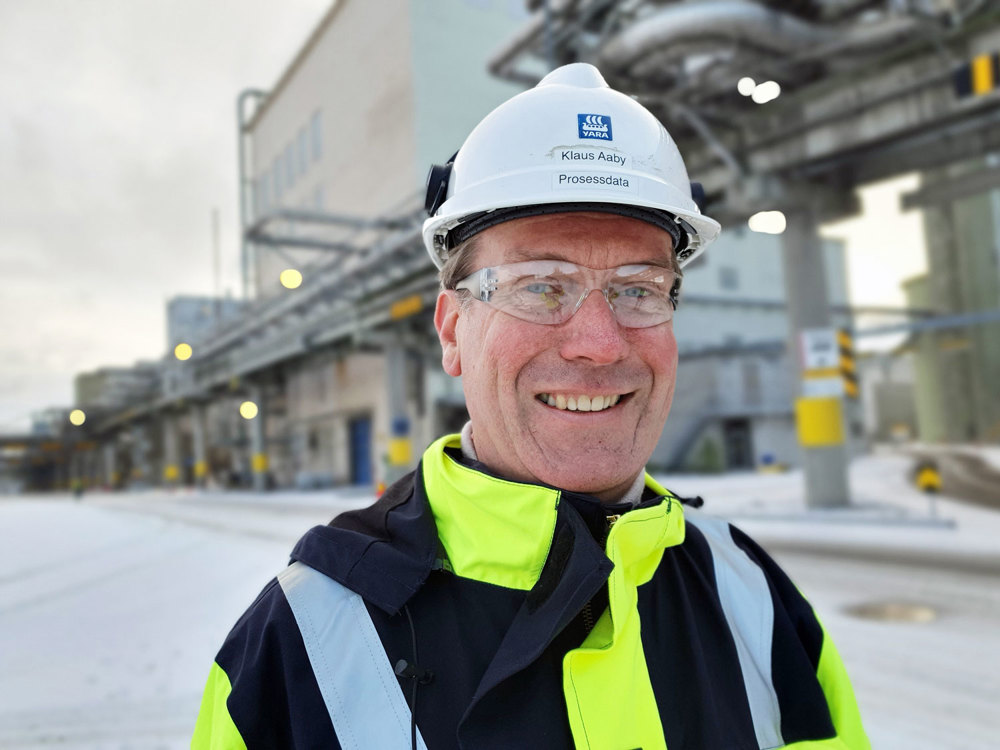
"Each shift in the production gets an overview from the control system of analysis data from the lab, product specifications and dosage tables from the Production Control System," Klaus explains.
"This relevant because recipes change. We now have a system that lives with changes, both in recipes, a living product range and a quality assurance system.
A number of upgrades are planned in the future.
"I believe we will simplify and improve the overview images further," says Klaus Aaby.
Interdisciplinary teamwork gives better solutions
Yara's happy process team believes it is the interdisciplinary nature that makes the group strong.
"We have experienced over many years, that the good solutions are found in the borderland between Process operations, chemical and Process Data.
"We have managed to turn a few thousand data from the process into useful information in an optimal way. It does not necessarily mean that we have to buy new equipment. Rather, we have reshuffled the way of thinking on how we can present and utilize information, resulting in more fertiliser and better quality."
31. January 2023